01 / Origin
Why isn't my job running?
On a shared cluster, a pending job can be waiting for resources, priority, an account or QoS limit, a dependency, a reservation, or a constraint on the nodes it can use. Slurm reports a reason code, but understanding what that code means can still require several commands and knowledge of how the site is configured.
I built Slurm View around that support problem. It puts the job, scheduler state, and the relevant context in one place, so a user can tell whether to wait, change the request, release a hold, or take the right information to support.
02 / Product
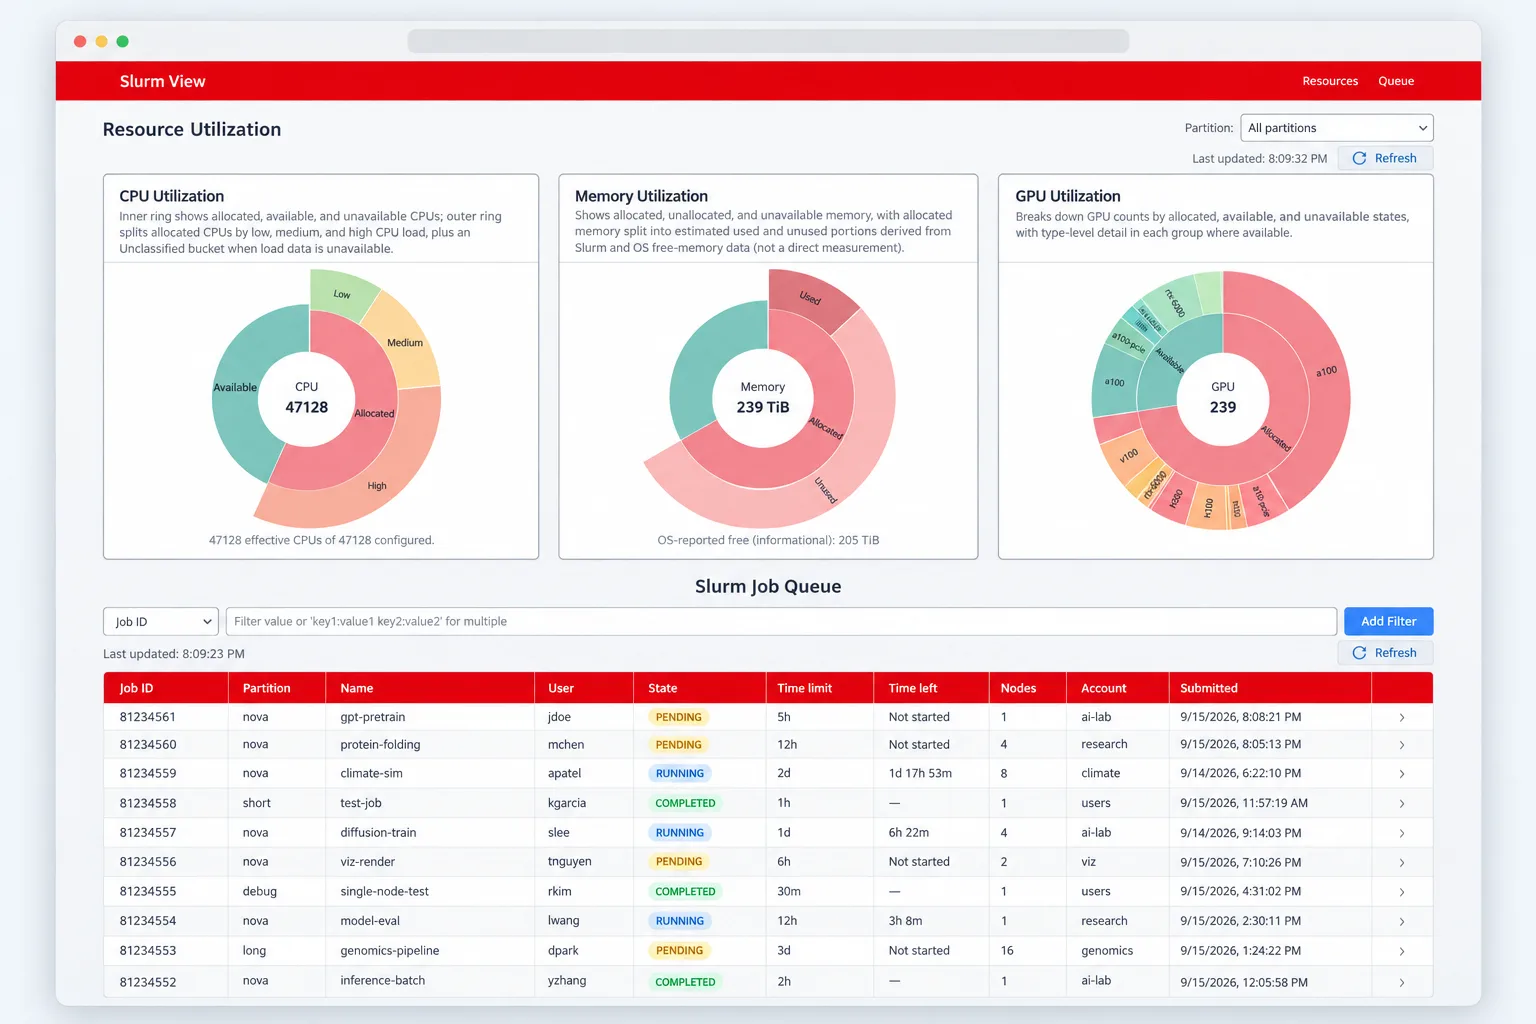
Cluster overview and job queue
The dashboard shows CPU, memory, and GPU utilization across the cluster, with the same view available for individual partitions. The job queue can be searched, filtered, and sorted without dropping back to the command line.
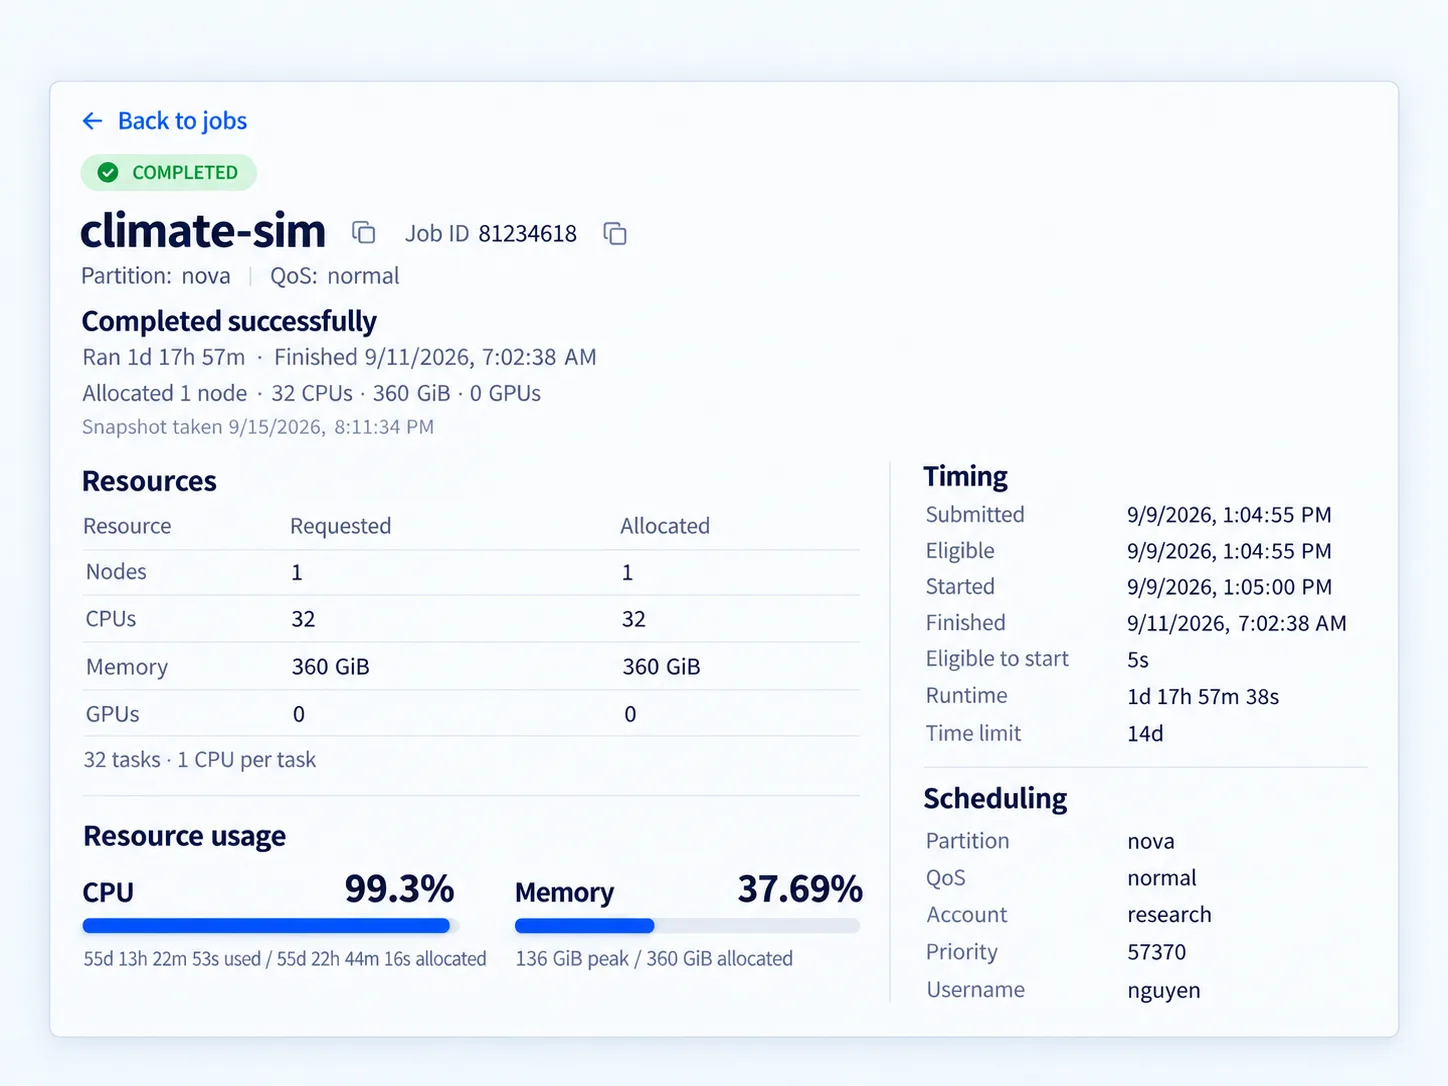
Opening a job brings its timing, requested and allocated resources, nodes, dependencies, and other scheduler information together in one view. Completed jobs can also include CPU and memory efficiency from seff, making it easier to see when substantially more resources were requested than the job used.
03 / System
Polling and cached scheduler state
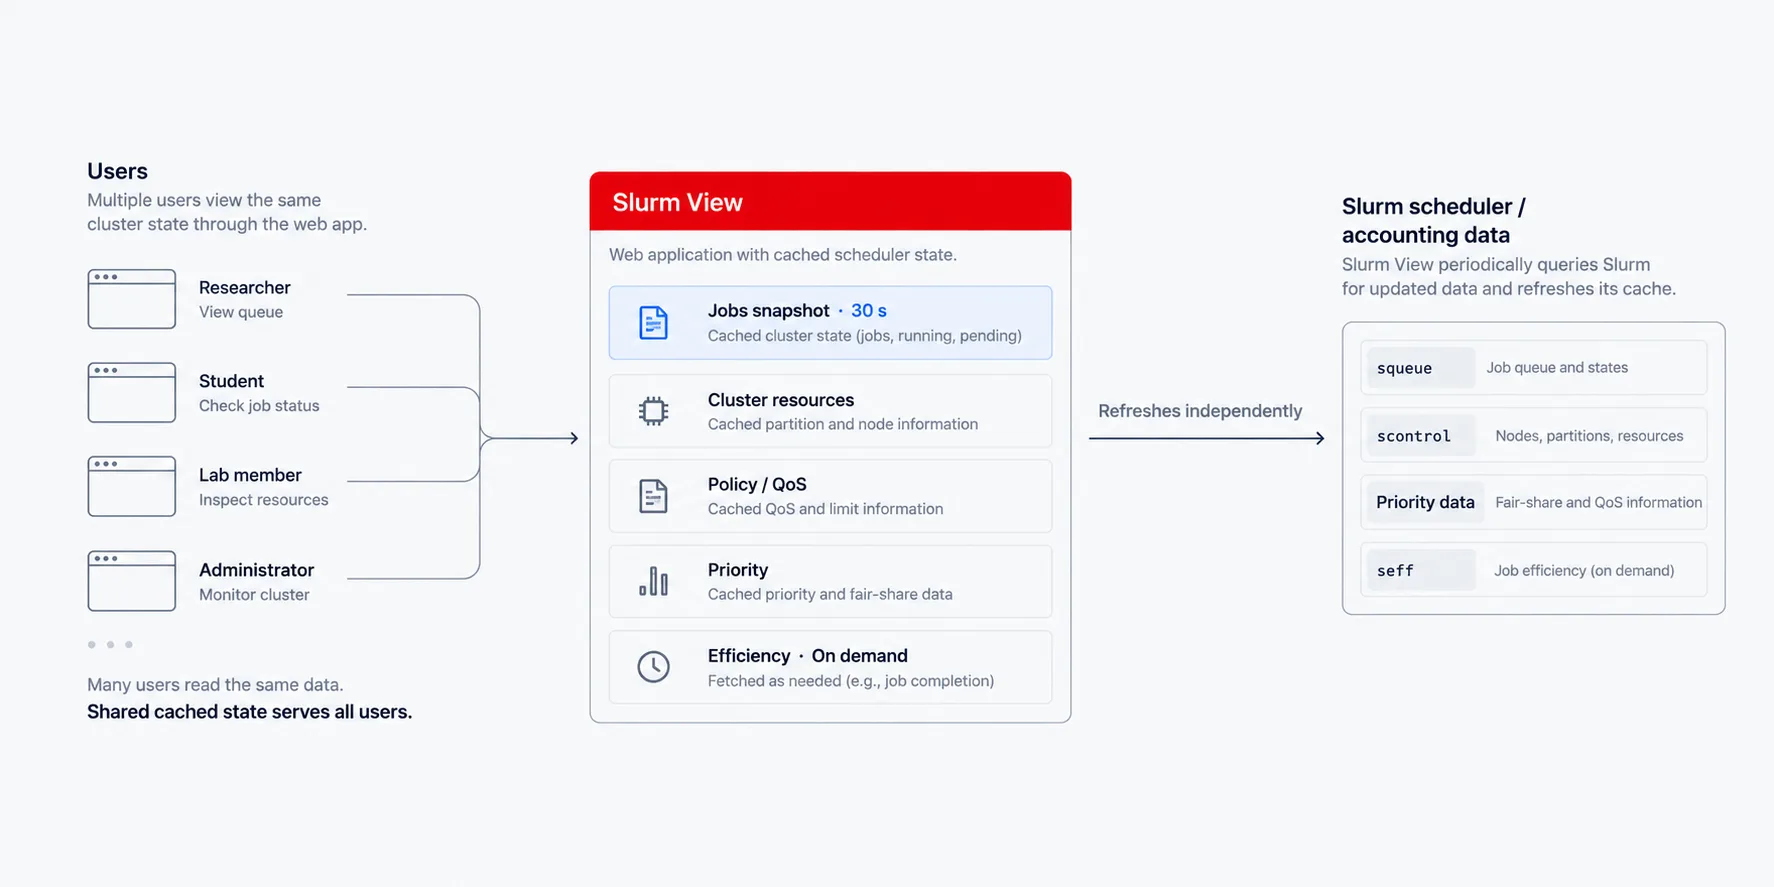
Running squeue and scontrol for every page view would make the dashboard itself another source of load on the scheduler. Slurm View centralizes those calls in a background poller and serves normal requests from cached scheduler state instead.
The live job snapshot refreshes every 30 seconds. Cluster resources, account and QoS policy, priority data, pending analysis, and efficiency results use separate caches based on how quickly the underlying information changes. Many people can use the interface without producing the same Slurm queries for every browser request.
04 / Detail
Explaining pending jobs
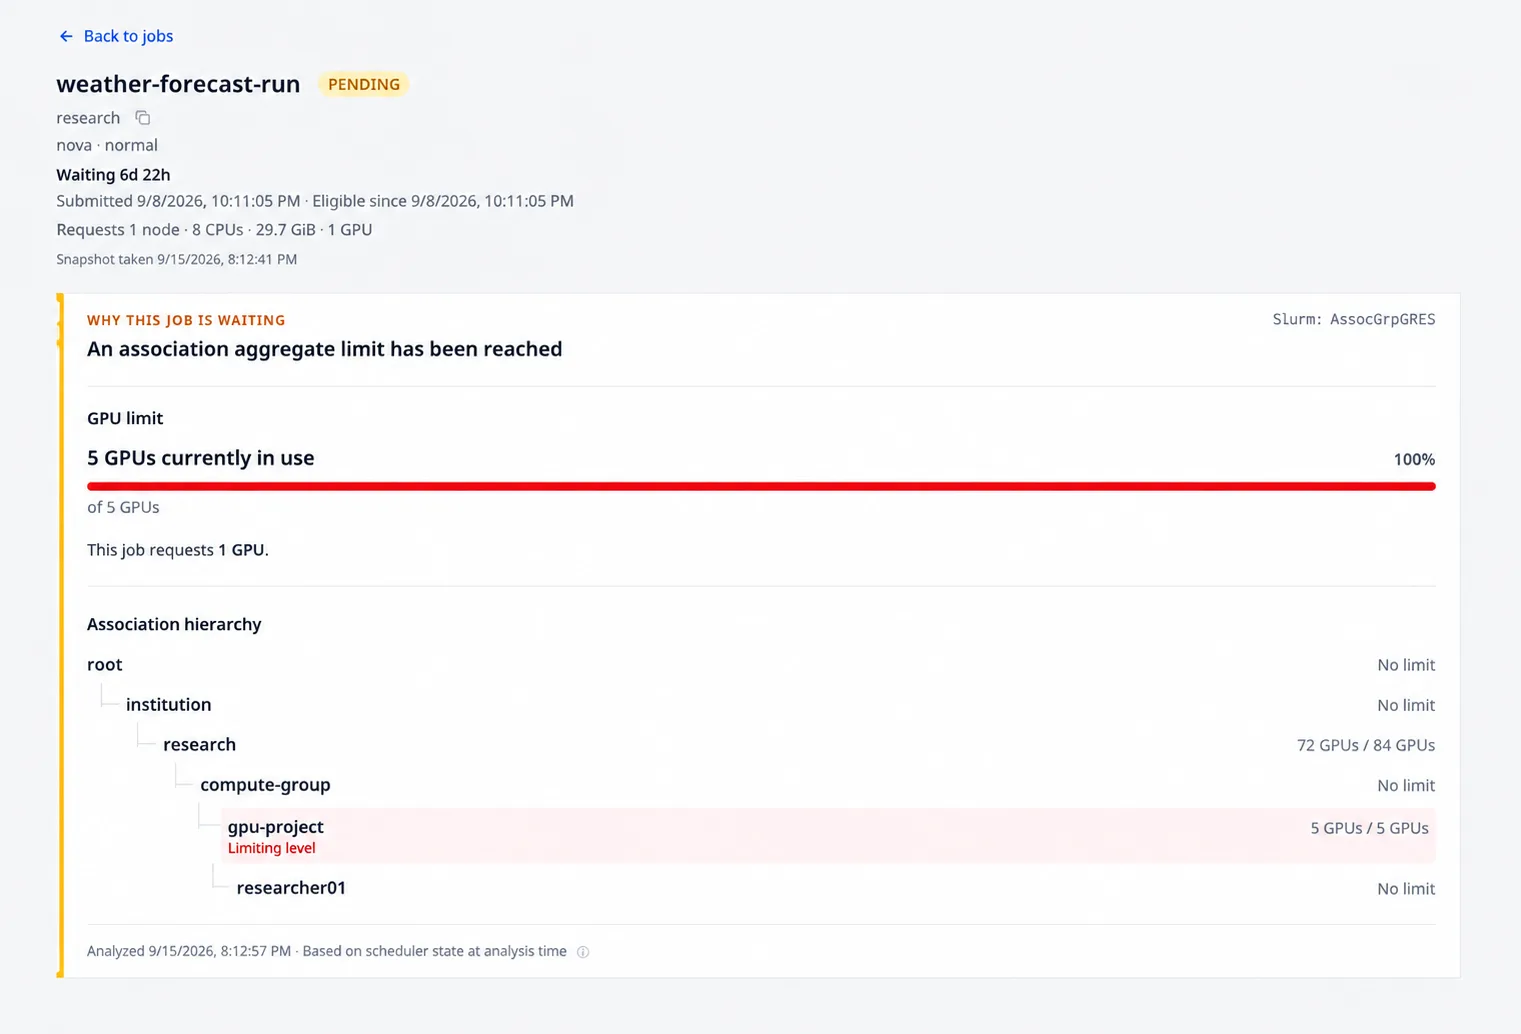
The reason reported by Slurm is the starting point. For jobs waiting on resources, Slurm View checks the requested CPU, memory, GPU, and node shape against what is available in the target partition. For Priority, it uses scheduler priority information to show where the job sits relative to competing work.
Association and QoS limits require different context. Slurm View follows the account hierarchy, identifies the limit that is blocking the job, and compares current usage with the configured cap. It also handles dependencies, reservations, holds, partition and node constraints, and job-array limits without replacing Slurm's reported state with a prediction.
05 / Open source
Open source and PEARC '26
Slurm View is MIT-licensed and distributed as an Open OnDemand application. Prebuilt releases include the server and web client, so a site can install it without building the frontend on the cluster.
The project was published at PEARC '26 as Slurm-View: Actionable Guidance for HPC Users, co-authored with Robert Grandin. The paper covers the user-support problem, the polling and caching architecture, and the approach used to add context to Slurm's pending reasons.